LinkedIn Follower Growth Rate Benchmarks by Industry
Compare your growth rate to your industry and account size, not your gut.

A follower count by itself tells you almost nothing. The number that actually means something is your monthly growth rate: followers gained over the period, divided by where you started. A manufacturing founder adding a steady trickle of followers every month might be doing better, relative to peers, than a marketing agency founder adding triple the number. It depends entirely on what's normal for the industry each one is standing in.
Account size matters too, and it has to be read alongside industry. An account with 2,500 to 10,000 followers (what this piece calls "established") grows at a different pace than a brand-new account or one that's been posting for five years. If you compare your rate to the wrong size tier, or the wrong industry, you'll either celebrate a number that's actually mediocre or panic over a number that's actually fine.
A healthy baseline growth rate before industry adjustments
Before getting into industry specifics, it helps to know what "healthy" looks like in general for an established LinkedIn account, since industry will then push that number up or down.
| Account Stage | Follower Range | Typical Monthly Growth Rate | |---|---|---| | New | 0-500 | Highly variable, often 10%+ | | Building | 500-2,500 | 5-8% | | Established | 2,500-10,000 | 2-4% | | Mature | 10,000-50,000 | 1-2% | | Authority | 50,000+ | 0.5-1.5% |
A 3% monthly rate, compounded, doubles your follower count in about two years. That's an unflashy headline number, but it's the kind of quiet, steady growth that adds up to something real if you stick with it. Once you know where your account sits on this table, the industry numbers in the next section will actually mean something, instead of floating around as numbers with no anchor.
Industry follower growth rate benchmarks for established accounts
Industry is the biggest single factor separating fast-growing LinkedIn accounts from slow ones, even when account size and posting frequency are identical. Two founders can post the same amount, with the same care, and end up in entirely different growth brackets just because of the sector they work in.
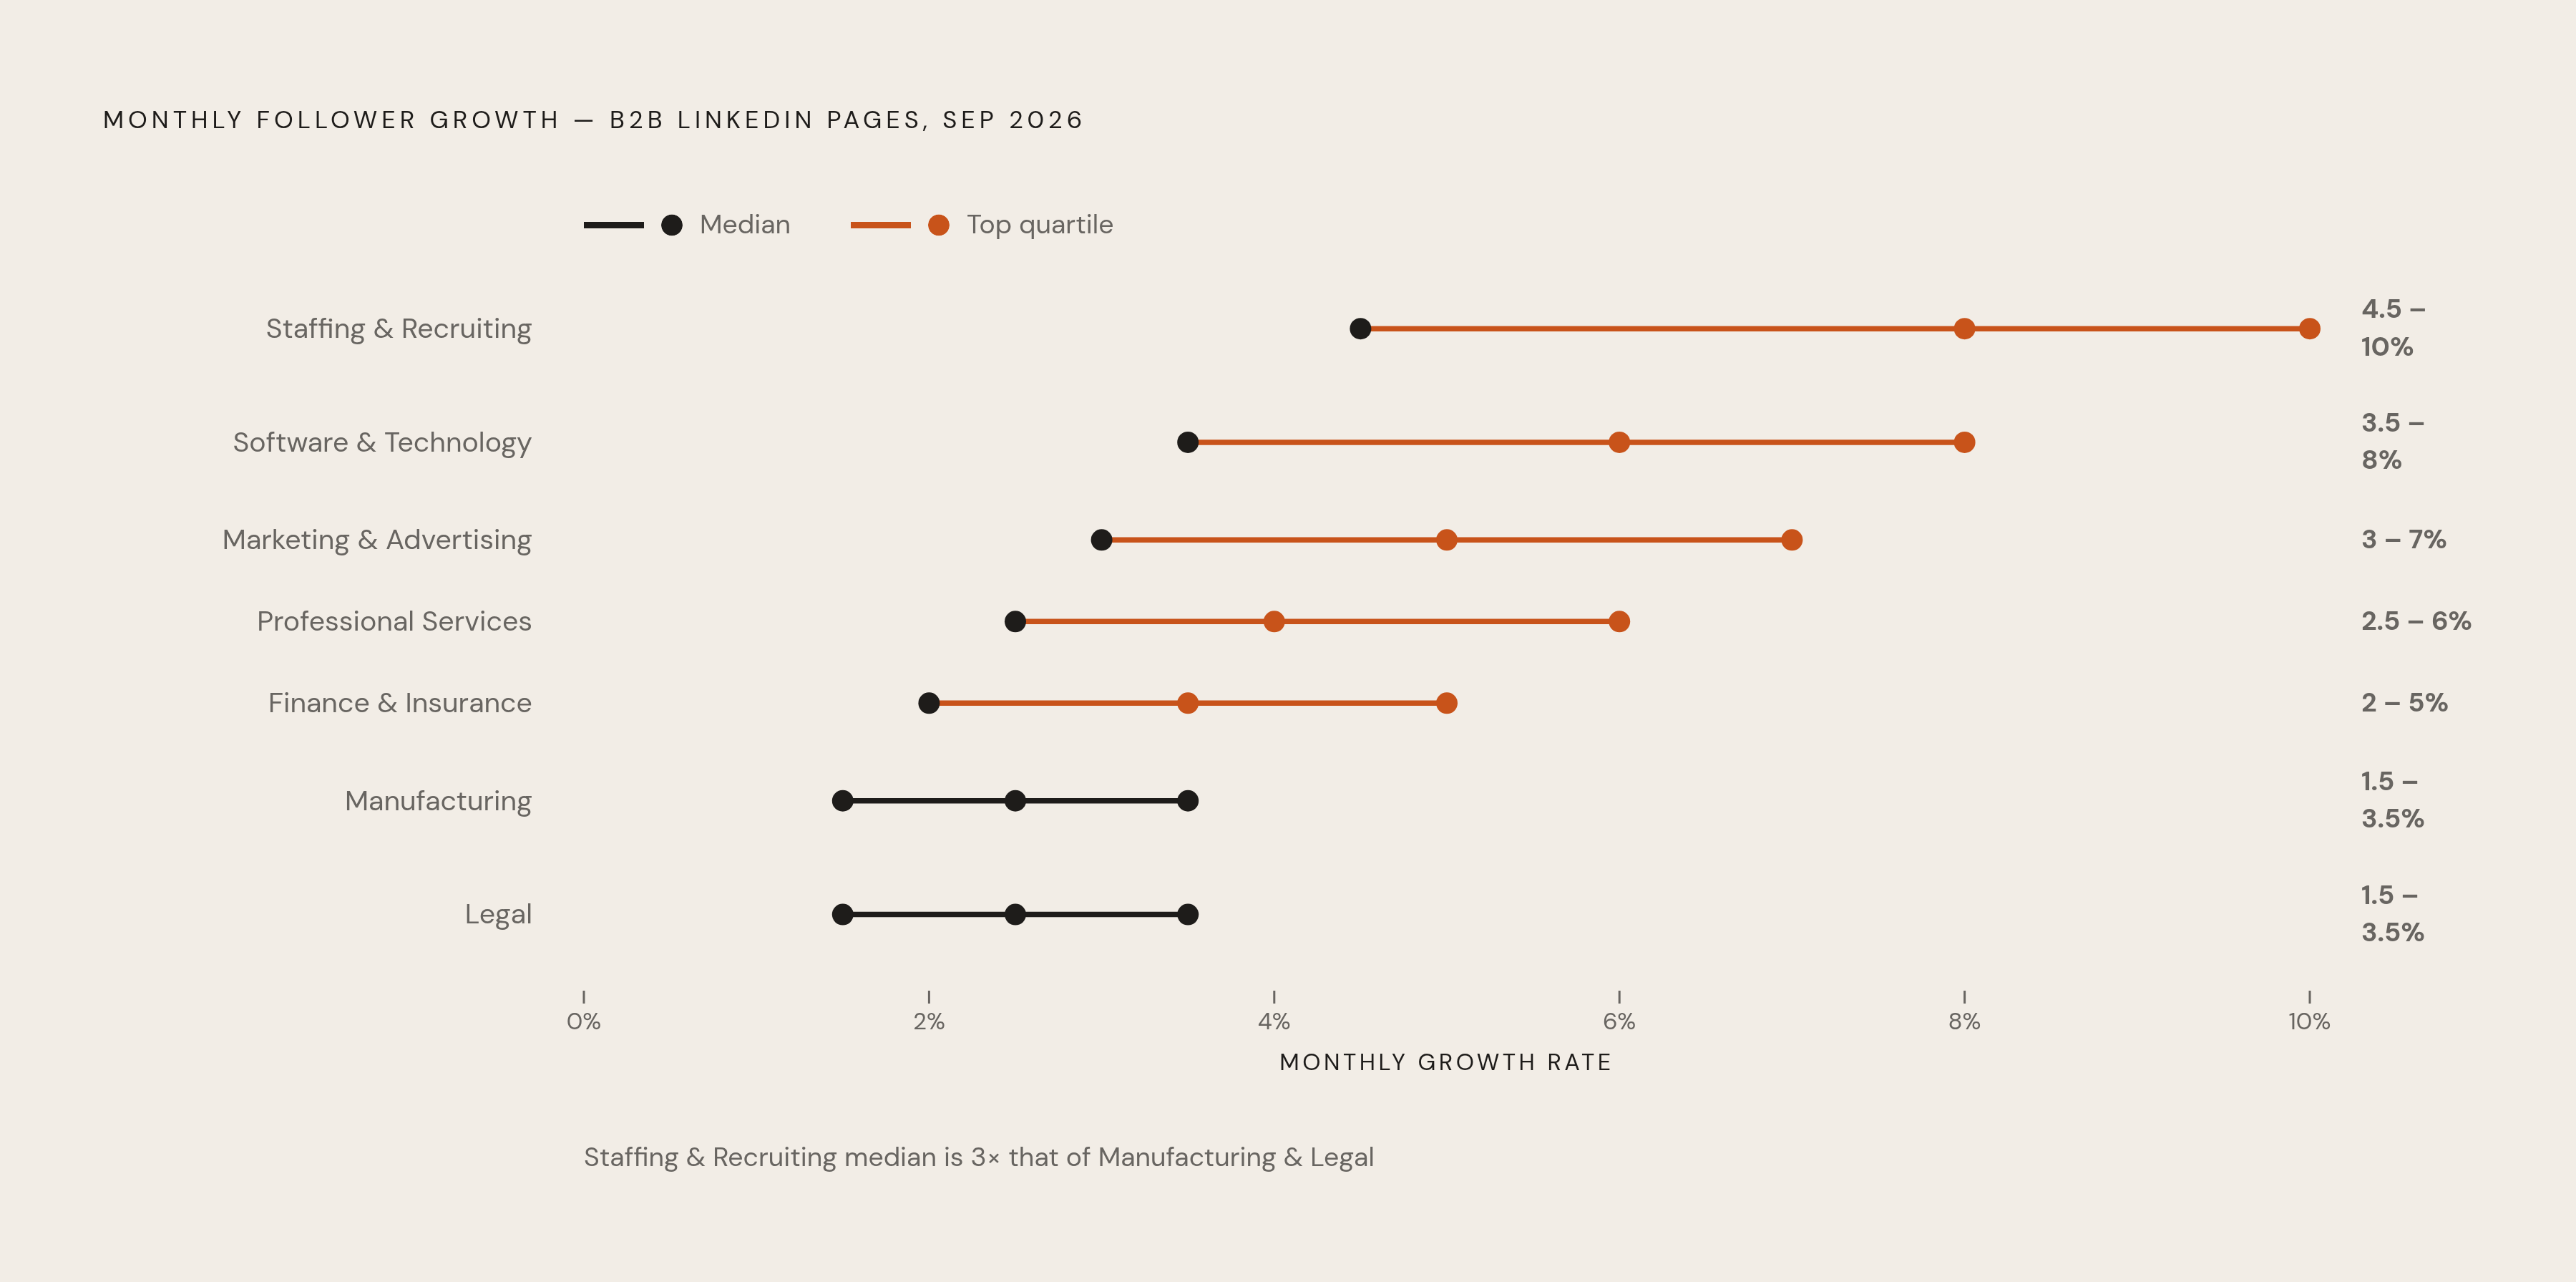
The table below applies to established company pages as of September 2026, built from compiled social benchmark reporting and tracked B2B founder and agency client accounts. A quick flag before you read it: these numbers describe company pages, not personal founder or executive profiles, which tend to grow faster and behave differently.
| Industry | Median Monthly Growth | Top-Quartile Monthly Growth | |---|---|---| | Staffing & Recruiting | 4.5% | 8-10% | | Software & Technology | 3.5% | 6-8% | | Marketing & Advertising | 3% | 5-7% | | Professional Services | 2.5% | 4-6% | | Finance & Insurance | 2% | 3.5-5% | | Manufacturing | 1.5% | 2.5-3.5% | | Legal | 1.5% | 2.5-3.5% |
Look at the spread. The median for staffing is roughly three times the median for manufacturing or legal. That's a substantial gap, and no amount of clever content calendar planning closes it on its own, because the gap isn't about content quality but something structural, which the next section gets into.
The redistribution mechanism behind industry growth rates
The large gap between the higher median in staffing and the much lower median in manufacturing comes down to one thing above everything else: how often people in that industry reshare what they see. Recruiters, marketers, and software people live on LinkedIn, and sharing is part of how they do their jobs. Lawyers and manufacturing executives are reading the platform too, but they're far less likely to hit "repost," because that's just not how their professional culture uses the platform.
So a low median in manufacturing or legal isn't a verdict on the quality of anyone's posts. It reflects what the audience does with content once they see it, not whether the content deserved to be shared. A manufacturing founder posting genuinely strong material will still see slower growth than a staffing founder posting something mediocre, purely because the staffing founder's audience reshares at a much higher rate.
That reframe matters, because it tells a manufacturing or legal founder what they should actually be competing against. The goal isn't to match a recruiter's growth rate, but to hit the top of what's achievable inside their own industry's structural ceiling. That ceiling is reachable, and reaching it comes down to two things a founder actually controls. Those two things are covered next.
The two levers that separate top-quartile accounts from median accounts in any industry
Within any single industry, from legal to staffing, the gap between the median account and the top-quartile account is explained by two behaviors, and neither one is "write better posts." They are outbound engagement and posting cadence.
Outbound engagement, the time spent commenting on other people's posts rather than only publishing your own, drives a disproportionate share of follower growth. This runs against the instinct most founders have, which is to pour all their time into writing the next post and treat commenting as an afterthought. In practice, showing up in other people's comment sections, where their audience can see you, is often what turns a casual viewer into an actual follower.
Posting cadence has a clear sweet spot too. There's a point of diminishing returns where a sixth or seventh weekly post stops adding much, and the time spent producing it would do more for growth if it went toward commenting on other people's posts instead. Profile optimization (headline, banner, featured section, about blurb) doesn't drive growth on its own, but it multiplies the return on everything else: it's what turns a profile view triggered by a good comment into an actual follow.
Engagement rate by industry versus follower growth rate
Engagement rate and follower growth rate move together often enough that it's easy to confuse them, but they measure two different things. Engagement rate tells you how intensely your existing audience interacts with a given post. Follower growth rate tells you whether new people are actually joining that audience. A post can rack up likes and comments entirely from people who already follow you, without bringing in a single new follower. Tracking only one of these two numbers can lead you to the wrong conclusion about how your content is performing.
For context, construction and manufacturing leads all B2B sectors in 2026 at 4.13% average engagement, a number pulled up by exactly the kind of high-engagement, low-reshare audience described earlier. Technology and software runs somewhat lower on engagement by comparison. Finance and insurance posted the largest year-over-year engagement gain of any B2B sector tracked, a meaningful jump from where it sat the year before.
A founder sitting in a high-engagement, low-redistribution industry, like manufacturing or construction, should weight engagement depth (comments, saves, the right people sliding into DMs) more heavily than raw follower growth as the main signal of how things are going. The platform-wide average engagement rate gets pulled up significantly by small personal accounts posting casually, so a B2B founder benchmarking against that headline number is comparing themselves to the wrong population. Benchmark against accounts your own size, in your own sector, and the number you get back will actually tell you something.
Follower growth rate and business outcomes for founders
For a founder who's fundraising, hiring, or selling, follower growth rate is a leading indicator of inbound deal flow rather than a vanity stat sitting off to the side of the real business. A growing, visible LinkedIn presence feeds directly into the processes that actually move a company forward.
Investors research founders on social media before meetings, and for the vast majority of them, that research is already part of how they decide whether to take the meeting seriously. It's part of the credibility check that happens before anyone sits down at a table, not something added on after.
The 2025 Edelman-LinkedIn B2B Thought Leadership Impact Report found something similar sitting on the buyer side. Finance, legal, procurement, and operations stakeholders, the people who rarely interact directly with a sales team, said consistent, high-quality thought leadership made them meaningfully more receptive to being reached out to. A growing LinkedIn presence puts a founder in front of exactly these stakeholders passively, without a single cold email sent. And the same compounding logic applies to hiring: a founder posting regularly about culture, product decisions, and the lessons learned the hard way is running a recruiting campaign that costs nothing extra per person it reaches. An audience growing at a top-quartile rate makes that recruiting effect stronger every month, not weaker.
Using your industry benchmark to set a realistic 90-day growth target
A benchmark is a tool for setting a target that actually accounts for where an account sits, what its industry allows for, and which of the two controllable levers need more attention over the next three months.
Start by finding your current account stage, using the five-tier table from earlier in this piece, new, building, established, mature, or authority, and note where your own growth rate falls relative to that stage's typical range. From there, pull up your specific industry's median and top-quartile monthly growth rate from the benchmarks table above, so you know both where most accounts in your field land and what the best ones are hitting. The 90-day target that actually makes sense is somewhere between your current rate and the top-quartile figure for your own industry, not the top-quartile figure for staffing or software if you happen to run a manufacturing company. Chasing a number from a faster industry just sets up a target that was never realistic to begin with.
Once that target is set, the two levers already covered, outbound engagement volume and posting cadence, become the actual dials to adjust, and growth rate (not raw follower count) is the number worth checking every month. Tracking the rate instead of the count strips out the distortion that comes from comparing a small account to a much bigger one. Real progress stays visible even for a founder in a naturally slower-growth industry like legal or manufacturing. For founders trying to move faster than organic posting alone can carry them, particularly those actively fundraising or hiring, a structured approach to content and engagement, built around an authentic point of view and run by someone who actually understands the mechanics described above, can close that gap in a way that occasional solo posting rarely manages on its own.